Quick Analysis Tab
Quick Analysis ROIs are ROIs drawn over top of previously collected image data still in the live display to take quick measurements from the image data. It provides the maximum, minimum, average, and standard deviation of the image data enclosed by its scanfields at the cross-section with the current viewport’s current z position as determined by the display slider.
This is commonly used for alignments / microscope characterizations but is available also as a standalone, simple, fast image analysis tool.
Keyboard Shortcuts
Shortcut |
Description |
|
Add an ROI |
|
Load ROI Group for quick analysis |
|
Save ROI Group for quick analysis |
Quick Analysis ROIs
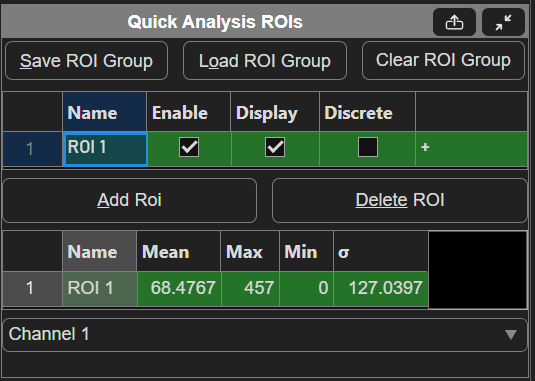
Table Column |
Description |
Save ROI Group |
Saves the current quick analysis ROI Group to a file for reuse at a later time by loading. |
Load ROI Group |
loads a previously saved ROI group to be used for quick analysis. Can get any ROI group that uses rotated rectangle scanfields. |
Clear ROI Group |
Clears the quick analysis ROI Group of |
ROI parameters table |
|
Analysis Table |
Displays the mean, maximum, minimum, and standard deviation of the pixel values contained within the ROI at the slice at depth of the current z in the selected viewport. |
Channel dropdown |
The channel of the image data to use for the analysis |
Quick Analysis Scanfields
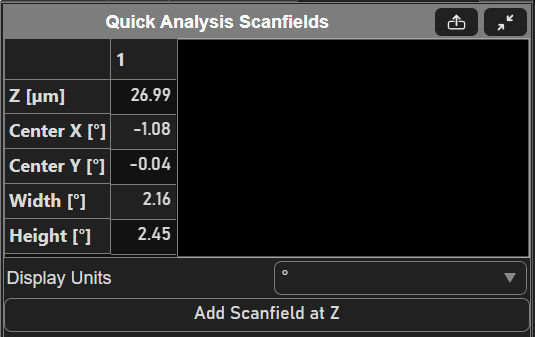
Table Column |
Description |
Scanfield Parameters Table |
|
Display units |
The units that the data in the table are displayed in. Choices are optical degrees [°], microns [µm] or pixels. |
Add Scanfield at Z |
Adds a scanfield to the selected ROI at the current Z of the viewport.
|