Waveform Controls
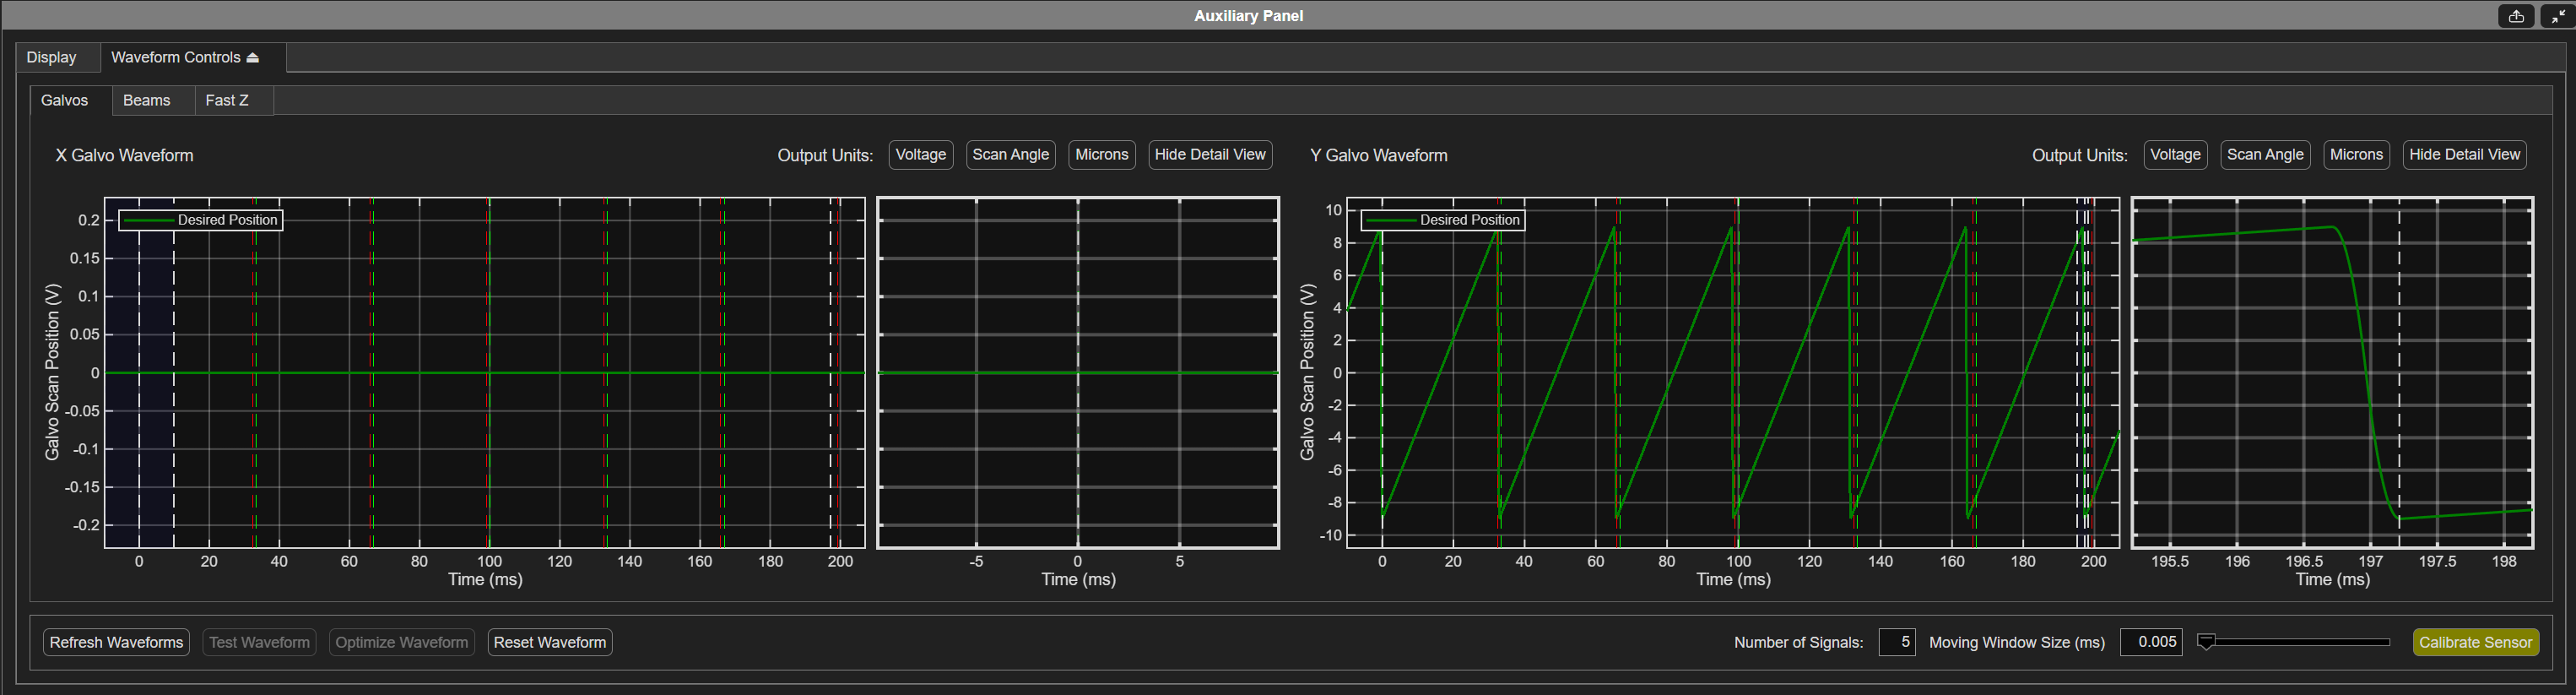
Galvo Waveform Controls
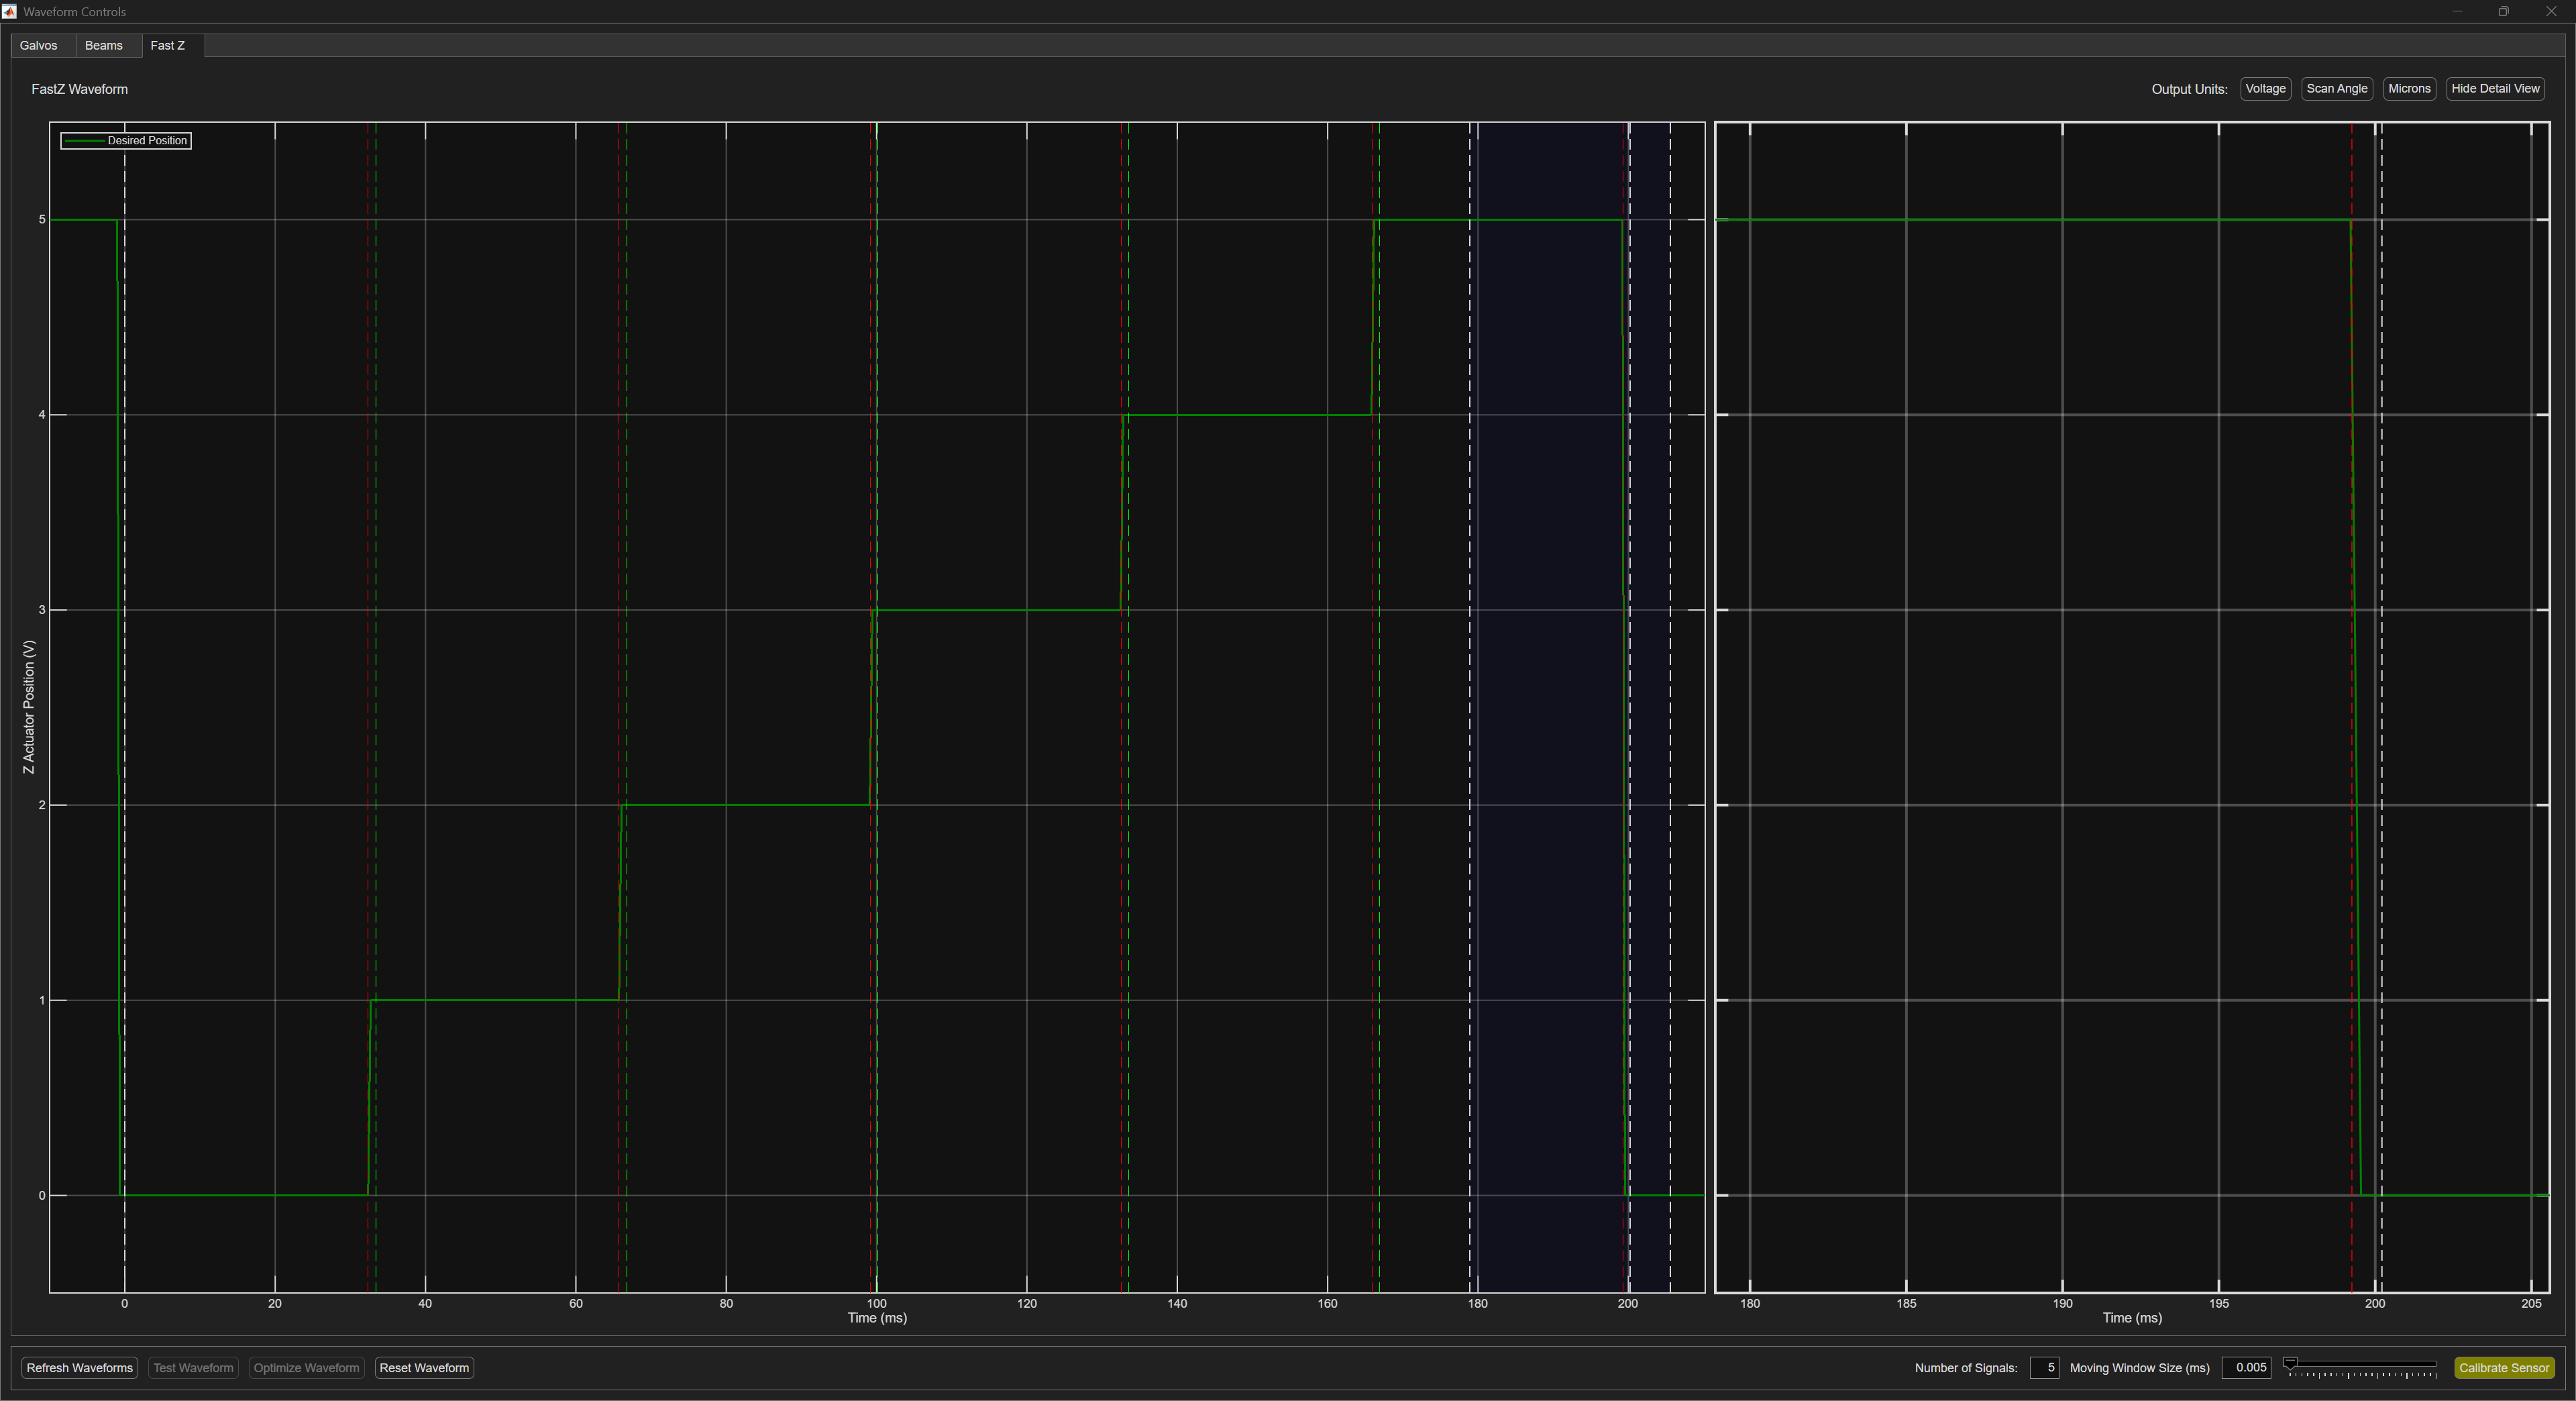
FastZ Waveform Controls
Note
Review the page Command Waveform Optimization for more information.
Waveform Controls is the GUI for waveform viewing, testing, and automated optimization. Select which device waveform to view from the tabs at the top of the GUI.
Buffer length
Long dashed lines in the graph indicate the start and finish of the waveform buffer. The buffer length depends on the current configuration:
For 2D raster scanning, the buffer is the length of a frame.
For 3D raster scanning (a stack), this is the length of a volume.
For arbitrary line scanning, it is the length of the ROI Group.
Detail View Window
The draggable blue window in the graph indicates the start and end of the Detail View.
Legend
The legend in the top left of each graph indicates which traces are Desired Position, Feedback Position, and/or Output Signal. In the absence of an output signal trace, the desired position trace is the output signal trace.
Waveform Controls
Refresh Waveforms |
Regenerate the scanning command waveforms for the current scan settings. |
Test Waveform |
Execute the current waveform and display feedback. |
Optimize Waveform |
Automatically iteratively execute and improve the waveform using the collected feedback. |
Reset Waveform |
Return from an optimized waveform to the default waveform for the configured scan. |
Number of Signals |
This Optimize Waveform parameter is the number of waveforms to send to the when testing performance. Increasing the number of signals may give a more accurate average feedback value, but increases optimization time. |
Moving Window Size (ms) |
This Optimize Waveform parameter is the window size (in ms) of the moving average. The larger the window, the more averaged out the feedback waveform will be. |
Calibrate Sensor |
Calibrate the sensor by collecting feedback while traversing the range of the actuator. Note A calibrated sensor is a prerequisite for waveform optimization. |
Waveform Display Controls
Output Units |
The y-axis can be plotted using various units, e.g. Voltage, Scan Angle, Microns, or Power Fraction |
Show/Hide Detail View |
The Detail View of the graph can be shown or hidden |